

With the new Analytics feature in Canvas learn how to evaluate individual components of a course and evaluate student performance
- in course navigation, click the new analytics link.
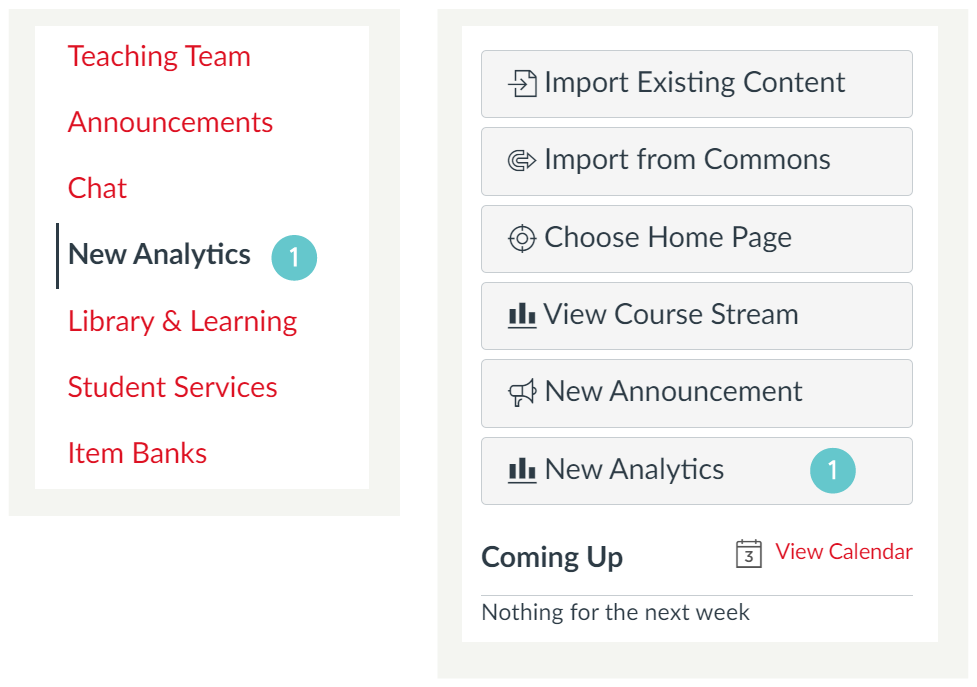
- This will take you to the course analytics page
- At the top of the page you will see Course Grade, Weekly Online Activity, Students, Reports,
- Click on All Sections to add an additional item for comparison, you can have three items displayed at any time.
- On the x-axis, it displays icons that indicate what the coloured dots relate to – Assignments (pen and paper) or Quizzes (rocket).

- By clicking on the Drop Down menu buttons (three dots), you can choose the view of the Course Grade information.

- On Data Table view, click one of the percentages in the right column.

- A graph will appear displaying the class Grade Distribution for that Assignment or Quiz.

- Select Weekly Online Activity to view the average (all students) page view and participation.
- Click All Sections to compare students or sections. You can select up to three items.


You can access and track individual progress and performance results for each of your students
- Select Students. All students in the class are presented in a table. You will see their Grade, % On Time, Last Participation, Last Page View, Page Views, and Participations.
- Click on the Students name to view see more information about an individual student.

- Click on the headers Course Grades, Weekly Online Activity, and Communication to see more information

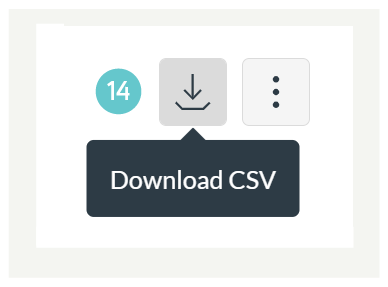
- The Download CSV button below gives you the opportunity to produce a CSV (Excel Spreadsheet) file that can be saved or a hardcopy print as required.
- Clicking on Reports, give you the ability to Run or produce any of the five types of reports available to you.
